Mastering the Nepse Alpha Chart: From Beginners to Expert
The Nepse Alpha Chart is a strong tool that may provide useful insights to investors and traders in order for them to make educated decisions on the Nepal Stock Exchange (NEPSE). This detailed tutorial will walk you through every aspect of the Nepse Alpha Chart, including its features, how to utilize it, and how to incorporate it into your trading strategy.
This blog article will offer an in-depth look at the Nepse Alpha Chart, including:
- What exactly is the Nepse Alpha Chart?
- The Nepse Alpha Chart and How to Use It
- How to Interpret the Nepse Alpha Chart Data
- How to Use a Nepse Alpha Chart in Your Trading Strategy
- Other Nepse Alpha Chart-Related Topics
What exactly is the Nepse Alpha Chart?
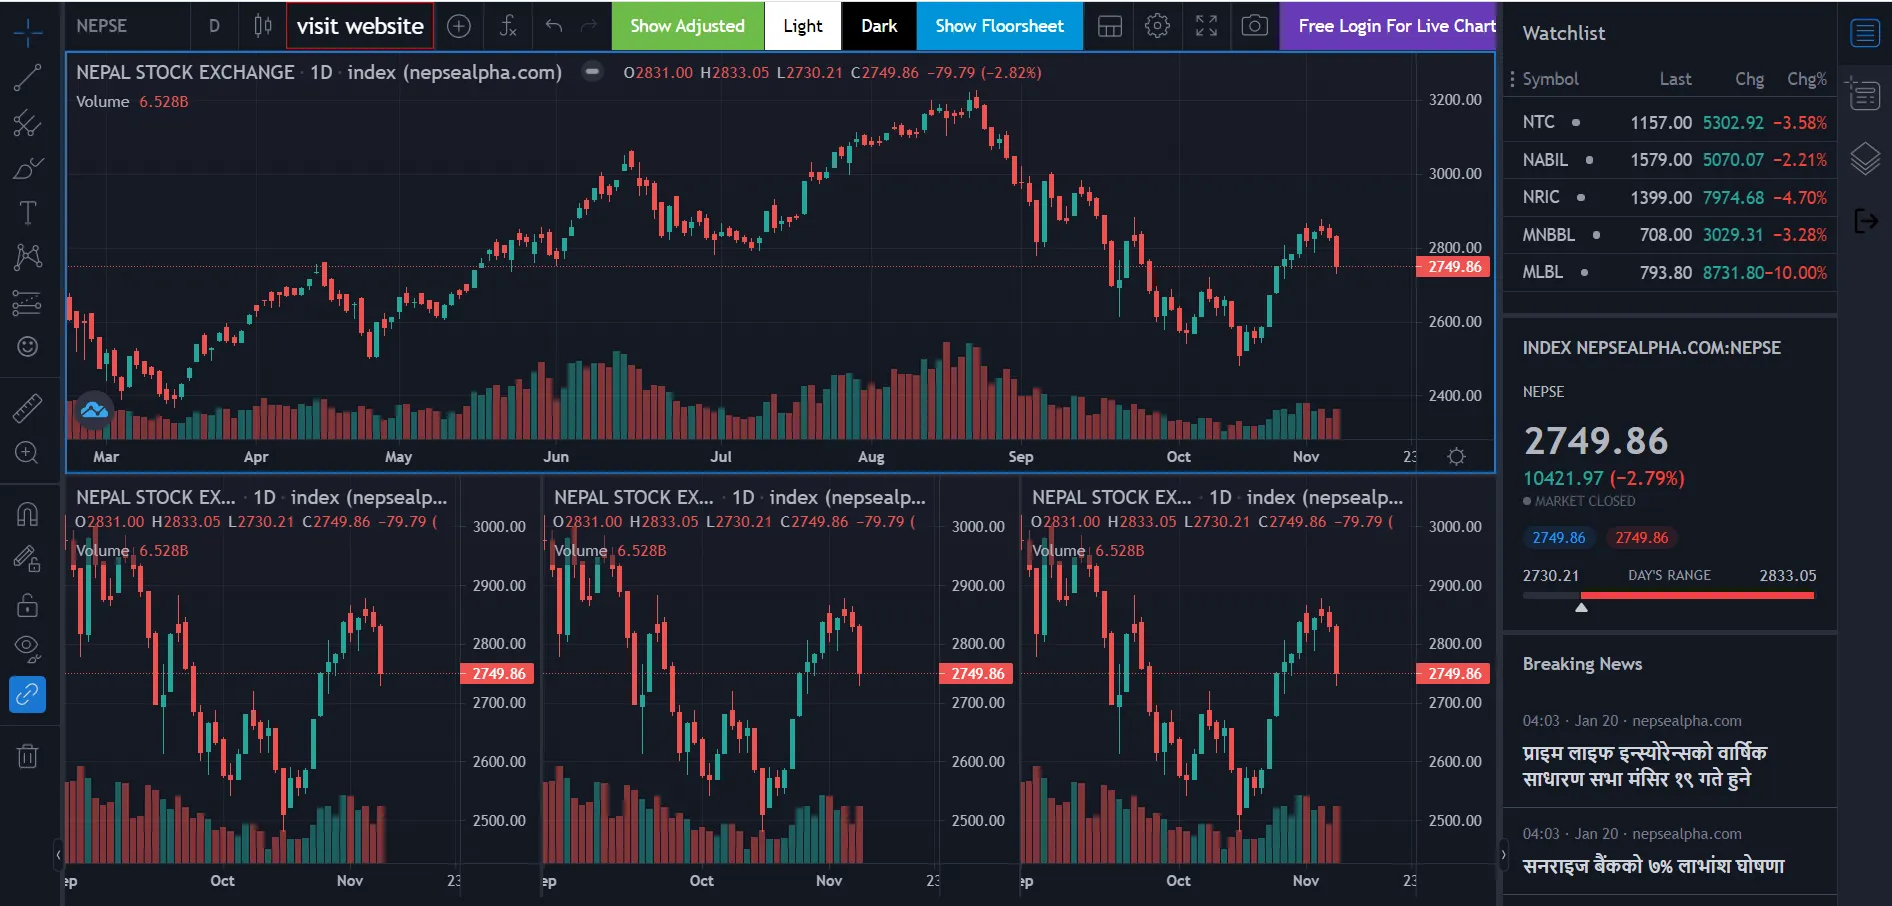
The Nepse Alpha Chart is a web-based charting software that provides real-time and historical data for all NEPSE equities. It includes a number of technical indicators, such as moving averages, MACD, RSI, and Bollinger Bands. To access the Nepse Alpha Chart, go to https://www.nepsealpha.com/trading/chart.
How to Use the Nepse Alpha Chart
It is simple to use the Nepse Alpha Chart. Simply input the ticker symbol of the company you wish to research, and you'll be presented with a live chart exhibiting its price history and different technical indicators. Here are some applications for this tool:
- Identify Breakouts: Look for equities with above-average trading activity that are breaking out.
- Support and Resistance: Use the chart to identify levels of support and resistance for risk management.
- Overbought and oversold conditions: Use technical indicators such as the RSI to spot probable reversals.
- Candlestick Patterns: Recognize bullish candlestick patterns such as hammers or engulfing patterns.
How to Read the Data on a Nepse Alpha Chart
While the Nepse Alpha Chart has a plethora of information, comprehending it is critical. Here's a breakdown of some key technical indicators:
- Moving averages: These aid in the identification of trends and levels of support and resistance.
- Bollinger Bands: This volatility indicator aids in the identification of support/resistance levels as well as overbought/oversold scenarios.
- MACD: The moving average convergence divergence displays momentum, trend reversals, and divergences.
- RSI: The relative strength indicator is used to detect overbought and oversold circumstances.
Using the Nepse Alpha Chart in Your Trading Approach
You may include the Nepse Alpha Chart into your trading plan after you understand how to read its data:
- Find Breakouts: Look for equities that are breaking out with trading activity that is above typical.
- Candlestick Patterns: Watch for patterns that indicate an upward trend, such as bullish candlestick patterns.
- Support and Resistance: Establish stop-loss orders by identifying levels of support and resistance.
- Situations of Overbought and Oversold Conditions: Look for possible trend reversals with technical indicators.
Other Nepse Alpha Chart-Related Subjects
Apart from what was previously discussed, the following subjects will help you gain a deeper comprehension of the Nepse Alpha Chart:
- Creating Custom Watchlists: Discover how to create custom watchlists using the Nepse Alpha Chart.
- Finding Investment possibilities: Learn how to use the Nepse Alpha Chart to identify possible investment possibilities.
- Backtesting Techniques: Learn how to backtest trading tactics to improve judgment.
Q&A
1.What advantages does the Nepse Alpha Chart offer?
The Nepse Alpha Chart has several advantages, such as complete stock data, ease of use, real-time updates, and no cost.
2.How can I spot trade chances using the Nepse Alpha Chart?
It may be used to identify overbought/oversold situations, breakouts, bullish candlestick patterns, and support and resistance levels.
3.What typical errors should one steer clear of while utilizing the Nepse Alpha Chart?
Steer clear of overtrading, disregarding fundamentals, depending too much on one indicator, and failing to use stop-loss orders.
4.What other resources are available to learn more about technical analysis and the Nepse Alpha Chart?
For community forums and lessons, go to the Nepse Alpha Chart website. To expand your expertise, think about reading technical analysis books or signing up for online classes.
With this guide at your disposal, you may investigate the Nepse Alpha Chart and choose the Nepal Stock Exchange with more knowledge. Cheers to your trading!